Cloudflare Workers Logging for Marketers & Developers
Cloudflare Workers Logging for Marketers & Developers

The fastest path to reliable, privacy-safe Cloudflare Workers logging is three steps: enable observability in your wrangler.toml (observability.enabled = true), emit structured JSON via console.log, and forward production events to a durable sink using event.waitUntil for non-blocking delivery. Cloudflare warns that a Worker without observability is a black box — you will not see intermittent errors until a customer reports them.
- Development:
wrangler dev+ Chrome DevTools gives you real-time breakpoints, CPU profiling, and console output. - Short-term inspection: Workers Tail or the dashboard’s real-time logs surface events immediately but can drop messages under load.
- Production persistence: Logpush or an external OTLP sink writes trace events to durable storage (R2, S3, BigQuery) where you can query them days later.
- Privacy-safe payloads: Strip IP addresses, hash identifiers, and keep only the fields your analytics actually need.
Pro Tip: Set head_sampling_rate and traces sampling in wrangler.toml before your first production deploy. Changing it after launch under live traffic causes gaps in your log history.
Table of Contents
- Get logs working end-to-end in under 30 minutes
- How to debug Workers locally with wrangler dev and Chrome DevTools
- Which production logging option should you use?
- The minimal production pattern for privacy-safe log delivery
- Privacy best practices for link analytics logs
- How to control costs with sampling and retention
- How Rdyrct implements Workers logging for privacy-first analytics
- Troubleshooting common logging problems
- Key Takeaways
- Why privacy-first logging is the only architecture worth building
- Rdyrct gives you privacy-first link analytics without building it yourself
- Useful sources
Get logs working end-to-end in under 30 minutes
This checklist takes you from zero to queryable logs in both dev and production.
- Add
observability.enabled = true(and optionallyhead_sampling_rate) towrangler.toml, then redeploy. - Run
wrangler devlocally and press D to open Chrome DevTools — breakpoints and console output appear immediately. - Emit at least one
console.log(JSON.stringify({ event: "test", ts: Date.now() }))and confirm it appears in the Workers Logs dashboard. - Create a Logpush job targeting R2, S3, or BigQuery with
dataset = workers_trace_events. - Set
head_sampling_rateper environment (100% staging, lower for production), and define which fields to redact before the payload leaves the Worker. - Generate a few test requests, then verify entries appear in both the dashboard and your sink.
- Confirm your API token has Logpush write permissions before step 4.
- Check destination verification — Cloudflare sends a test request to your sink URL.
- Keep a staging Worker at 100% sampling so you can reproduce issues without touching production config.
Pro Tip: Use a separate [env.staging] block in wrangler.toml to override head_sampling_rate = 1 for staging without touching production values.
How to debug Workers locally with wrangler dev and Chrome DevTools
Chrome DevTools integration is the fastest way to understand what your Worker is actually doing before it hits production. Run wrangler dev, press D, and you get the full DevTools panel: breakpoints, call stack, scope inspection, CPU profiling, and memory snapshots.
- Open a breakpoint on the line that builds your analytics payload to inspect every field before it is sent.
- Use
console.log(JSON.stringify(payload))in dev so the shape matches what production emits — no surprises when you switch environments. - Set a
DEBUGenvironment variable locally and gate verbose logs behind it:if (env.DEBUG) console.log(...). Production stays quiet; local dev stays chatty. - Watch for differences between local and production context: Durable Objects, KV bindings, and some network behaviors only exist in the real Cloudflare runtime, not the local simulator.
Pro Tip: Add a LOCAL_DEBUG=true secret to your local .dev.vars file. Gate expensive structured logs behind that flag so you never accidentally ship verbose payloads to production.
Which production logging option should you use?

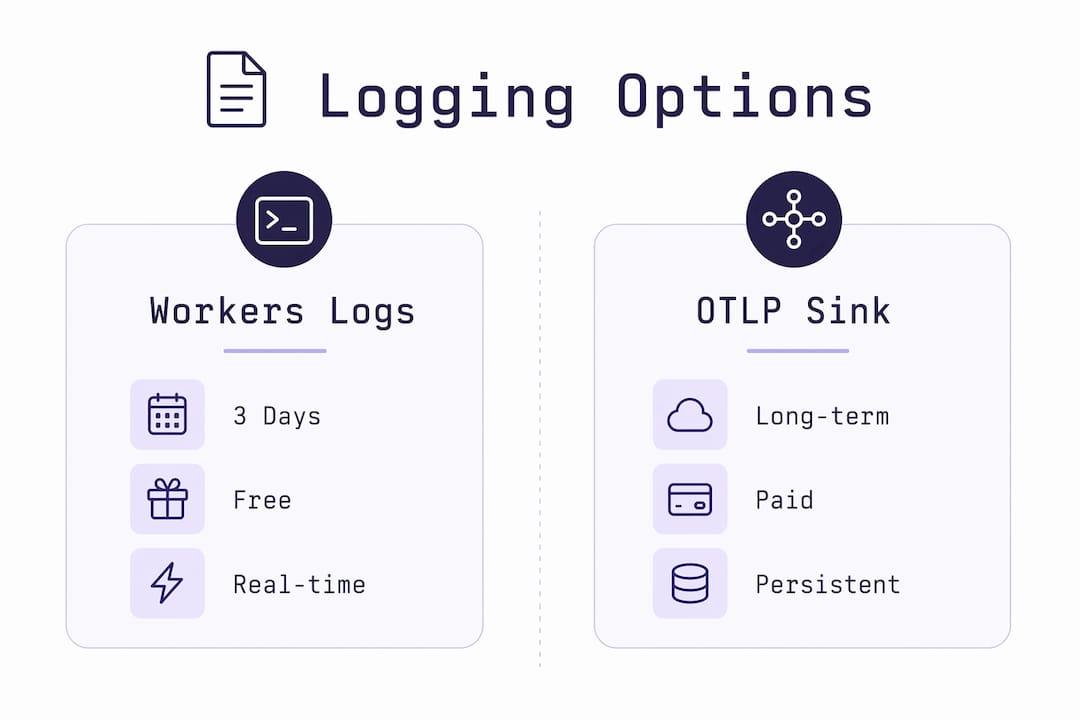
For persistent, queryable analytics, Logpush or an OTLP sink is the right answer. Workers Logs and real-time tailing are useful for quick checks, but neither is a substitute for durable storage.
| Method | Retention | Real-time? | Privacy control | Best for |
|---|---|---|---|---|
| Workers Logs (Free) | 3 days | Yes | Dashboard only | Dev and low-traffic debugging |
| Workers Logs (Paid) | 7 days | Yes | Dashboard only | Short-term troubleshooting |
| Real-time tail | Session only | Yes | None | Live incident inspection |
| Logpush → R2/S3 | You control | Near real-time | Full redaction before send | Production analytics |
| OTLP (Datadog, Sentry, Axiom) | Platform-defined | Yes | Platform-level | Observability platform users |
Real-time tailing enters sampling mode under high traffic and drops messages — it is not a primary persistence strategy. For link analytics at any meaningful scale, Logpush is the move.
Workers support OTLP export to platforms like Datadog, Sentry, Grafana Cloud, and Axiom. If your team already lives in one of those tools, OTLP is a natural fit. For privacy-focused setups where you want full control over what leaves your infrastructure, Logpush to R2 or BigQuery keeps the data in your own account.
To enable Logpush in wrangler metadata, set dataset = workers_trace_events and provide a destination_conf pointing to your verified sink. Cloudflare handles the delivery; you handle redaction on the Worker side before the payload is written.
The minimal production pattern for privacy-safe log delivery
Emit structured JSON, send it asynchronously, and never block the response path waiting for a network call.
export default {
  async fetch(request, env, ctx) {
    const payload = {
      ts: Date.now(),
      link_id: request.headers.get("x-link-id") ?? "unknown",
      referrer_host: new URL(request.referrer || "https://unknown").hostname,
      ua_class: classifyUA(request.headers.get("user-agent")),
      // No IP address. No raw user-agent. No query strings.
    };

    console.log(JSON.stringify(payload));

    ctx.waitUntil(
      fetch(env.LOG_SINK_URL, {
        method: "POST",
        headers: { "Content-Type": "application/json" },
        body: JSON.stringify(payload),
      })
    );

    return handleRequest(request, env);
  },
};
Key decisions in this pattern:
ctx.waitUntil(the production equivalent ofevent.waitUntil) fires the sink fetch after the response is returned — zero latency added to the user’s request.- The payload carries
link_id,referrer_host, and a reducedua_classstring. No IP, no full user-agent, no raw query string. - Set
head_sampling_rate: 0.1in productionwrangler.tomlandhead_sampling_rate: 1in staging so you capture everything during testing and 10% in production.
Pro Tip: Route logs through a small R2-backed collector that batches writes. A single batch write per 500 events costs a fraction of 500 individual sink calls and keeps your Logpush payload well under the 16,384-character combined limit for logs and exceptions.
Privacy best practices for link analytics logs
Keep analytics minimal: timestamp, shortened-link ID, referrer domain, device class, and coarse geography. That set answers every marketing question without storing anything personal.
- Never log IP addresses. Cloudflare’s edge sees the IP; your Worker does not need to pass it downstream.
- Truncate or hash identifiers before writing them. A one-way hash of a session token is useful for deduplication; the raw token is a liability.
- Strip query strings from referrer URLs. A referrer like
https://example.com/page?email=user@example.combecomesexample.comin your log. - Avoid capturing UTM parameters that contain personal data — campaign names are fine, but custom UTM fields sometimes carry email addresses or CRM IDs.
- Document your log schema. Marketers need to know what analytics are available; a written schema prevents ad-hoc field additions that accidentally capture PII.
Cloudflare recommends a written retention policy aligned to your security and compliance requirements. Set retention windows in BigQuery or your external sink to match that policy — raw events for 30 days, aggregated daily counts for 12 months is a reasonable default for most link analytics use cases.
Pro Tip: Define a privacy-by-default log schema as a TypeScript type. Any field not in the type cannot be logged — the compiler enforces your privacy rules before the code ships.
How to control costs with sampling and retention
Reduce volume with head-based sampling, server-side batching, and short retention windows for raw logs. Persist summarized aggregates longer.
| Daily requests | Sampling rate | Estimated logs/day | Recommended raw retention |
|---|---|---|---|
| — | 100% | — | 7 days |
| — | 10% | — | — |
| — | 1% | — | — |
| — | 0.1% | — | 30 days |
Workers Free gives you 200,000 events per day at 3 days retention; Workers Paid includes 20 million events per month at 7 days retention, with overage at $0.60 per additional million. For anything beyond 7 days, Logpush to BigQuery is cheaper than extending Workers Logs.
- Sample errors at 100% regardless of your global
head_sampling_rate— you want every exception. - Sample normal traffic at 1%–10% depending on volume.
- Run daily aggregate jobs (total clicks, unique referrers, device breakdown) and store those indefinitely. Raw events can expire.
Pro Tip: Set separate sampling rates for traces vs. invocation logs. Traces are heavier; a 1% trace rate with 10% log rate captures rare performance problems without drowning your sink.
How Rdyrct implements Workers logging for privacy-first analytics
Rdyrct uses Workers Logs for short-term debugging and a Logpush → R2 → BigQuery pipeline for persistent, privacy-filtered analytics. The architecture keeps personal data out of the pipeline entirely.
Fields Rdyrct stores:
link_id— the shortened link identifierts— Unix timestampreferrer_host— domain only, no path or query stringdevice_class— mobile, desktop, or tablet (derived from user-agent, then discarded)geo_country— country code from Cloudflare’scf.countryheader
Fields intentionally excluded: IP address, full user-agent string, full referrer URL, any query parameter.
ctx.waitUntil handles every sink write so link redirects stay fast. head_sampling_rate is set to 1 in staging and tuned per traffic tier in production. BigQuery retention rules expire raw events after 30 days; daily aggregate tables persist for 12 months and power the analytics dashboard.
Pro Tip: If you self-host Rdyrct on Cloudflare, mirror this minimal schema. You get marketing-useful signals — referrer, device, country — without storing anything that requires a privacy disclosure.
Troubleshooting common logging problems
Check observability config first, then sampling, then sink permissions.
- No logs in the dashboard: Confirm
observability.enabled = trueinwrangler.tomland that you redeployed after adding it. New Workers have observability on by default; older Workers may not. - Logs appear locally but not in production: Check that your API token has Logpush write permissions and that the destination was verified during job creation.
- Truncated messages: Logpush has a combined 16,384-character limit for the
logsandexceptionsfields. Cloudflare marks truncated entries with<< >>markers. Shorten payloads, strip stack traces from non-error logs, and truncate long field values before logging. - Dropped async sends: If
ctx.waitUntilfetches are not reaching your sink, check CORS headers on the sink endpoint and confirm the Worker’s outbound request is not timing out. - High volume overwhelming your sink: Drop
head_sampling_rateand add server-side batching. Real-time tailing enters sampling mode under load — do not rely on it to confirm every event arrived.
Pro Tip: Run a staging Worker with head_sampling_rate = 1 and deliberately trigger each error condition. Confirm the truncation markers and dropped-message behavior before you see it in production.
Key Takeaways
Structured JSON logs sent asynchronously via ctx.waitUntil, combined with Logpush to a durable sink and a written retention policy, give you reliable, privacy-safe Cloudflare Workers analytics without slowing down a single redirect.
| Point | Details |
|---|---|
| Enable observability before deploy | Set observability.enabled = true in wrangler.toml; older Workers do not have it on by default. |
| Use structured JSON logs | console.log(JSON.stringify(...)) makes fields automatically indexed and queryable in Workers Logs. |
| Send production logs to a durable sink | Logpush to R2, S3, or BigQuery persists events beyond the 7-day retention for Workers Logs Paid and 3-day retention for Workers Logs Free. |
| Redact PII at the source | Strip IP addresses, hash identifiers, and drop query strings before the payload leaves the Worker. |
| Rdyrct for managed privacy analytics | Rdyrct’s Logpush → R2 → BigQuery pipeline stores only link ID, referrer domain, device class, and country — no IP, no raw user-agent. |
Why privacy-first logging is the only architecture worth building
Most logging guides treat privacy as a compliance checkbox — something you bolt on after the analytics are working. That framing gets it backwards. When you design the log schema first and ask “what is the minimum field set that answers the marketing question,” you end up with a leaner pipeline, lower storage costs, and a system you can explain to any customer without a legal review.
The Rdyrct architecture described here is not a stripped-down version of a “real” analytics setup. It is the real setup. Referrer domain, device class, country, and link ID answer the questions marketers actually ask: where did clicks come from, on what device, and which link drove the most traffic. Everything else is noise that creates liability.
Small businesses running branded short links on Cloudflare Workers do not need a data warehouse full of raw user-agents and IP addresses. They need a fast redirect, a clean dashboard, and the confidence that their analytics respect the people clicking their links.
Rdyrct gives you privacy-first link analytics without building it yourself
If the architecture above is exactly what you need but you would rather not wire it up from scratch, Rdyrct ships it as a ready-to-use platform. You get branded short links, privacy-by-default analytics (referrer, device, country — no IP storage), and a Cloudflare-compatible deployment that mirrors the pattern described in this guide.
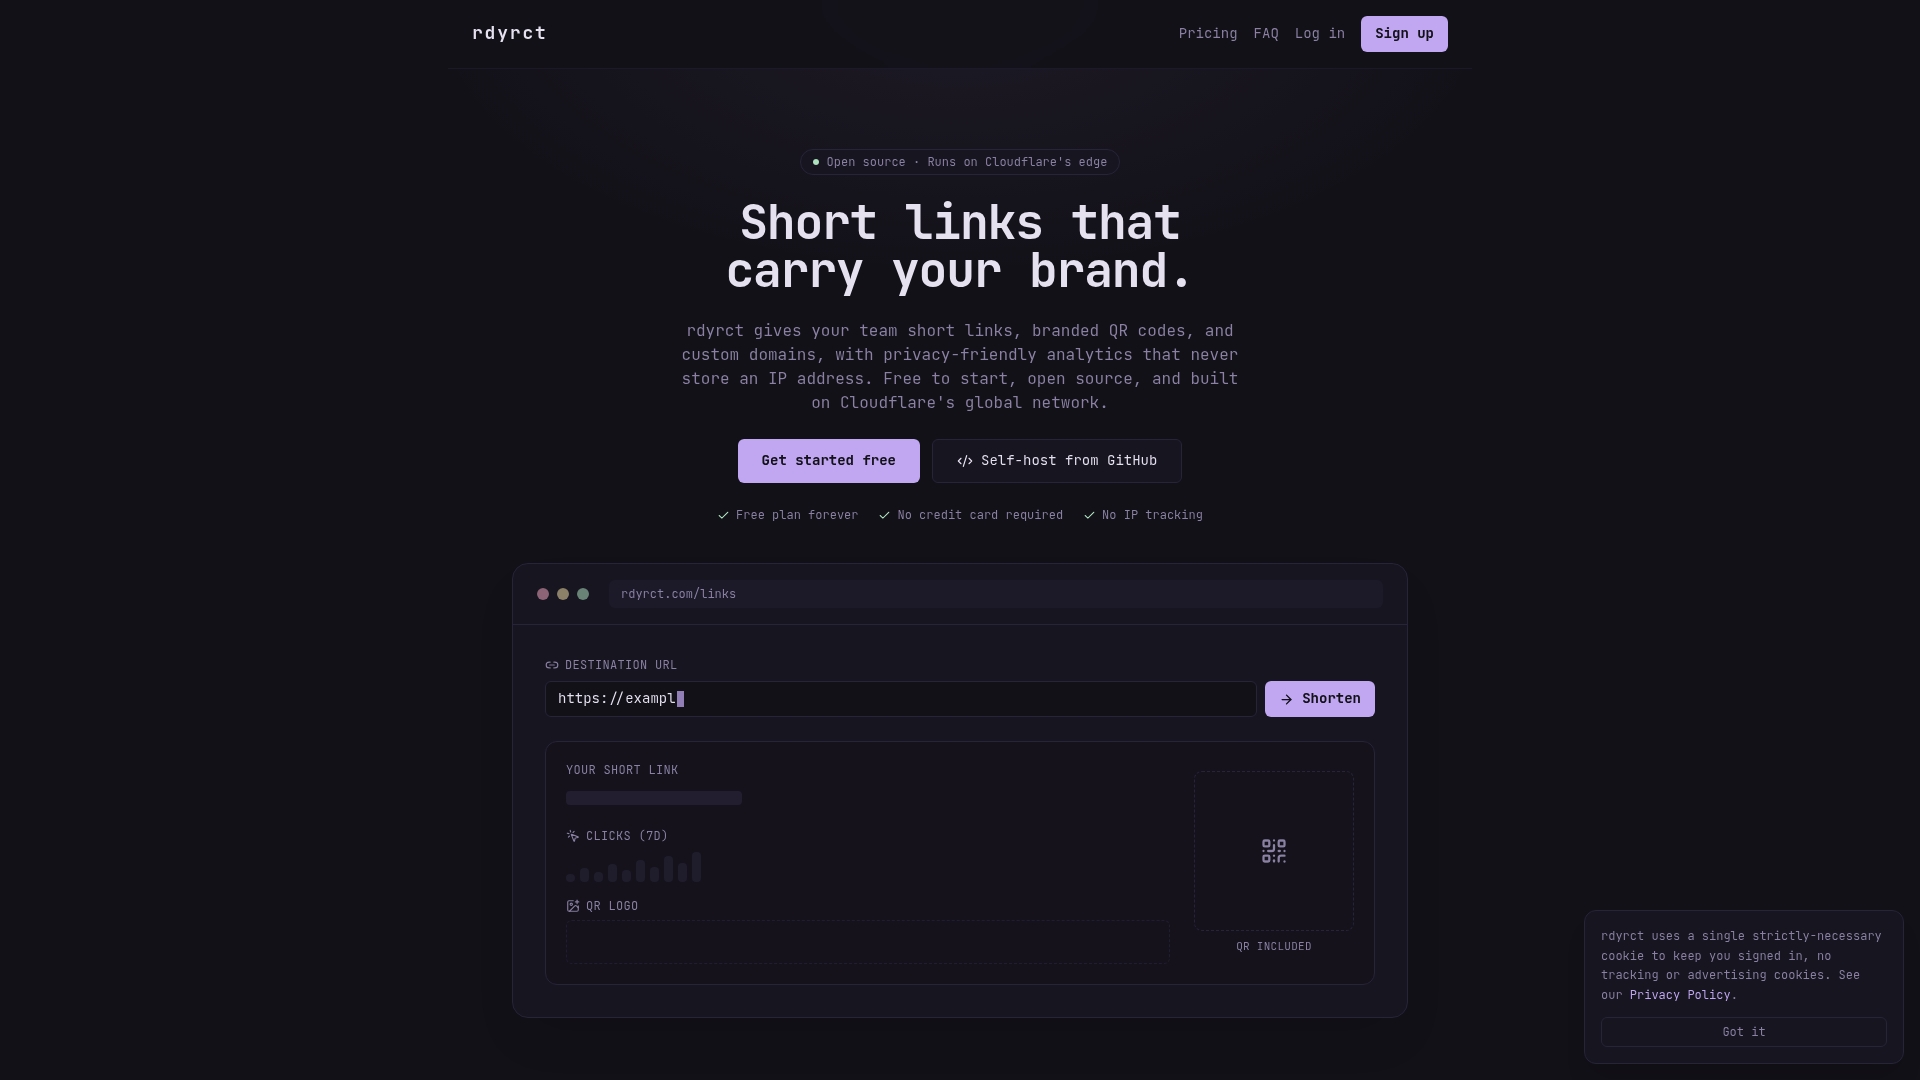
- No IP addresses stored, ever.
- Analytics cover referrer domain, device class, and country — the fields that matter for campaign tracking.
- Custom domains, branded QR codes, UTM builder, and team roles included.
- Self-hosting on Cloudflare is supported; the open-source option is available for teams that want full infrastructure control.
Start with the free plan or explore paid tiers at rdyrct.com — setup takes minutes, and the privacy architecture is already done.
Useful sources
Official Cloudflare documentation for configuration details, current limits, and dev workflows:
- Workers Observability overview — start here for the full picture of logs, traces, and OTLP export options.
- Workers Logs — plan quotas (Free: 200k events/day, 3 days; Paid: 20M/month, 7 days), JSON indexing, and dashboard search.
- Workers Logpush — destination setup, the 16,384-character truncation limit, and
workers_trace_eventsdataset config. - Real-time logs — covers sampling-mode behavior and when tailing is and is not appropriate.
- Chrome DevTools for Workers — the
wrangler dev+ DevTools workflow for breakpoints and profiling. - Breakpoints reference — VS Code and DevTools breakpoint setup, including the
--remotecost caveat. - Workers Best Practices — the black-box warning and
head_sampling_rateguidance. - Log retention best practices — retention policy framing, balancing real-time visibility with cost-effective storage.
Consult the Cloudflare docs directly for the latest limits — truncation thresholds and plan quotas do change, and staging is always the right place to verify behavior before production.